import matplotlib
import matplotlib.pyplot as plt
import numpy as np
import pandas as pd

from IPython.display import display
from PIL import Image

import os
# check for set environment variable JB_NOSHOW
show = True
if 'JB_NOSHOW' in os.environ:
    show = False
Basic Example, Data Analysis I#
Setup Description#
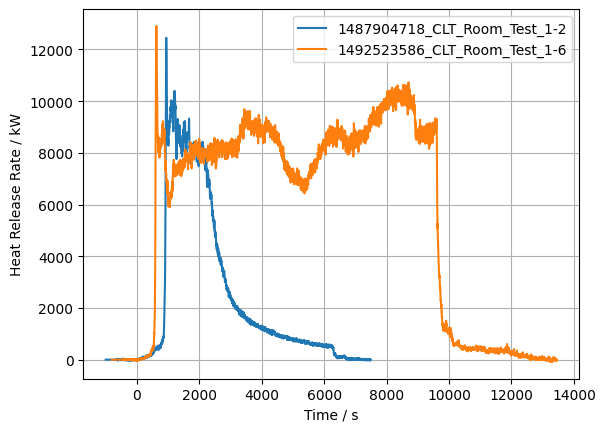
The task here is to create the plot, which depicts the heat release rates (HRR) of different fuel loads and ventilation openings in a room of the same geometry, taken from the NIST Fire Calorimetry Database (FCD) for Cross Laminated Timber Compartment Fire Tests.
We will follow these steps:
Download the data (CSV files): The CSV files can be found at: CLT_Room_Test_1-2 and CLT_Room_Test_1-6.
Read and plot the HRR values: We will use the Python libraries
osandpandasto access the file location and read the CSV files.matplotlibwill be used to plot the values.
#Import the libraries:
import os
import pandas as pd
import matplotlib.pyplot as plt
# Check files with experiment data.
folder_path=os.path.join("data", "Fire_calorimetry")
files = os.listdir(folder_path)
print(files)
['1487904718_CLT_Room_Test_1-2.csv', '1492523586_CLT_Room_Test_1-6.csv']
# Read the data from the experiments.
for file in files:
    # Filter out specific type of files.
    if file.endswith('.csv'):
        file_path = os.path.join(folder_path, file)

        # Read file.
        calorimeter_df = pd.read_csv(file_path,header=0)

        # Plot data series.
        plt.plot(calorimeter_df['Time (s)'],
                 calorimeter_df['Heat Release Rate (kW)'],
                 label="_".join(file.split('.')[0:-1]))


# Plot meta data.
plt.xlabel("Time / s")
plt.ylabel("Heat Release Rate / kW")

plt.legend()
plt.grid()

# Show plot.
plt.show()


