6.4. Example – 3D Heat Transfer#
Introduction#
Basically, the Fire Dynamics Simulator (FDS) differentiates between two models for the calculation of heat conduction. While the one-dimensional case only calculates the temperature profile normal to the surface, the HT3D model also calculates lateral heat diffusion. The 1D model is based on the one-cell method. For the coupling between solid and gas phase, it is important that the block of material is not wider than a cell, otherwise the heat will be transferred into a void phase with ambient temperature. Compared to the one-cell method, the HT3D model uses the multi-cell method. The representation of different material layers is done by apposition of different cells.
3D heat conduction - The HT3D model#
Three-dimensional heat conduction in a solid obstruction can be invoked by adding the HT3D=.TRUE. command in the respective OBST line. The heat transfer will automatically be calculated across several adjacent obstructions for that it is activated.
The material properties can be assigned to a solid obstruction by adding the MATL_ID on the OBST line or obtained from a certain SURF_ID. Note that the actual dimensions rather than the thermal THICKNESS of a SURF is taken into account for the computation of 3D heat transfer. For detailed information about the HT3D model please refer to section 11.3.9 of FDS User’s Guide.
Setup#
For this task use the beam_ht3d.fds input file. The geometry represents a beam obstruction that is divided into three parts featuring different material properties. The individual sections are heated up by a constant temperature at the bottom surface.

Fig. 6.40 SMV visualization of the geometry. The surface patch HEATER, which has a constant surface temperature of \(\mf 1000^\circ C\) (TMP_FRONT = 1000) ,is colored purple. The red surface patch BURNER provides a constant HRRPUA of \(\mf 100~kW~/~m^2\).#
Task#
The commands SOLID_PHASE_ONLY=.TRUE. on the MISC line and RADIATION = .FALSE. on the RADI line indicate that FDS turns off all gas phase computation as well as the RTE (Radiation Transport Equation) solver and therefore speeds up the computation. This can be useful if only the heat transfer in a solid obstruction is to be calculated.
For Task 1 - 3 only the constant heat source is considered since it is a pure solid phase computation. Gas phase and radiation computation may be turned on for Task 4 in order to resolve the heat release from the burner surface.
Step 1#
Implement the HT3D function in the given FDS input file and run the simulation for 3600 s. For this purpose:
Assign the material properties (
MATL) to the respective obstructions (OBST).Activate 3D heat transfer by adding
HT3D=.TRUE.to theOBSTlines.
Evaluate the temperature within the solid obstructions at timesteps t = 100 s, 1000 s, 3600s by adding SLCF in the XZ and YZ plane(s). Explain how the different temperature distribution is related to the respective material properties.
import fdsreader
from fdsreader.bndf.utils import sort_patches_cartesian
import numpy as np
import matplotlib.pyplot as plt
import pandas as pd
plt.rcParams['lines.linewidth'] = 1

root = '../../../../'
data_root = root + 'data/heat_transfer/ht3d_solid/rundir'
sim = fdsreader.Simulation(data_root)
slice_axial = sim.slices[0]
slice_steel = sim.slices[1]
slice_copper = sim.slices[2]
slice_concrete = sim.slices[3]

time = 3600
time_index = slice_steel.get_nearest_timestep(time)
vmin = 20
vmax = 800

fig, (ax1, ax2, ax3) = plt.subplots(1,3, figsize=(8,6), sharey=True)
heatmap = ax1.imshow(slice_steel[0].data[time_index].T, origin='lower', cmap='jet',vmin=vmin, vmax=vmax)
ax2.imshow(slice_copper[0].data[time_index].T, origin='lower', cmap='jet',vmin=vmin, vmax=vmax)
ax3.imshow(slice_concrete[0].data[time_index].T, origin='lower', cmap='jet',vmin=vmin, vmax=vmax)
ax1.set_title("Steel")
ax2.set_title("Copper")
ax3.set_title("Concrete")
fig.subplots_adjust(right=0.81)
cbar_ax = fig.add_axes([0.85, 0.17, 0.03, 0.67])
fig.colorbar(heatmap, cax=cbar_ax, label="Temperature / $^\circ C$")
ax1.set_xlabel("$n_{cells}~X$")
ax2.set_xlabel("$n_{cells}~X$")
ax3.set_xlabel("$n_{cells}~X$")
ax1.set_ylabel("$n_{cells}~Z$")
plt.savefig('figs/beam_temperatures_section_solid.svg', bbox_inches='tight')
plt.close()

fig, (ax1, ax2, ax3) = plt.subplots(3,1, figsize=(10,10), sharex=True)
time_index = slice_axial.get_nearest_timestep(100)
ax1.imshow(slice_axial[0].data[time_index].T, origin='lower', cmap='jet',vmin=vmin, vmax=vmax)
time_index = slice_axial.get_nearest_timestep(1000)
ax2.imshow(slice_axial[0].data[time_index].T, origin='lower', cmap='jet',vmin=vmin, vmax=vmax)
time_index = slice_axial.get_nearest_timestep(3600)
ax3.imshow(slice_axial[0].data[time_index].T, origin='lower', cmap='jet',vmin=vmin, vmax=vmax)
ax1.set_title("T = 100 s")
ax2.set_title("T = 1000 s")
ax3.set_title("T = 3600 s")
ax1.set_ylabel("$n_{cells}~Z$")
ax2.set_ylabel("$n_{cells}~Z$")
ax3.set_ylabel("$n_{cells}~Z$")
ax3.set_xlabel("$n_{cells}~X$")
ax1.text(10, 5, "Steel", ha='center', color='white')
ax1.text(30, 5, "Copper", ha='center', color='white')
ax1.text(50, 5, "Concrete", ha='center', color='white')
ax2.text(10, 5, "Steel", ha='center', color='white')
ax2.text(30, 5, "Copper", ha='center', color='white')
ax2.text(50, 5, "Concrete", ha='center', color='white')
ax3.text(10, 5, "Steel", ha='center', color='white')
ax3.text(30, 5, "Copper", ha='center', color='white')
ax3.text(50, 5, "Concrete", ha='center', color='white')
fig.subplots_adjust(right=0.81)
cbar_ax = fig.add_axes([0.76, 0.13, 0.02, 0.75])
fig.colorbar(heatmap, cax=cbar_ax, label="Temperature / $^\circ C$")
plt.savefig('figs/beam_temperatures_axial_solid.svg', bbox_inches='tight')
plt.close()

Fig. 6.41 SLCF of TEMPERATURE at X =-0.4, 0, 0.4 at timestep t = 3600 s for different materials (MATL) steel, copper, concrete (solid phase only)#

Fig. 6.42 SLCF of TEMPERATURE at Y = 0 at timestep t = 100, 1000, 3600 s for different materials (MATL) steel, copper, concrete (solid phase only)#
Step 2#
Create line arrays of devices at the center of each section (steel, copper, concrete) along the z-axis and evaluate the temporal temperature distribution along the height of the beam as a heatmap. Alternative: Create a SLCF with QUANTITY = 'TEMPERATURE' at PBY = 0 and use the FDS READER module to load the data into a numpy array. You can also evaluate the devices independently as a time temperature correlation. Refer to section 21.2.2 of FDS User’s Guide for more information on how to set up line arrays of point devices. To prevent FDS from only recording a steady-state profile set TIME_HISTORY=.TRUE. on the DEVC line.
Note
You can plot heatmaps of tabulated data by calling the pyplot.imshow function of matplotlib on a numpy.array with python. Even though spreadsheet programs like Excel do not usually support advanced plots like heatmaps directly, this can be achieved using conditional cell formatting with color scales.
A feasible plot could look as follows:

Fig. 6.43 SLCF of beam TEMPERATURE for different MATL steel, copper, concrete#
time_temp_df = pd.read_csv(data_root + "/beam_ht3d_solid_devc.csv", skiprows=1, index_col=0)
time_temp_steel_df = time_temp_df.filter(regex='Steel')
time_temp_copper_df = time_temp_df.filter(regex='Copper')
time_temp_concrete_df = time_temp_df.filter(regex='Concrete')

fig, (ax1, ax2, ax3) = plt.subplots(3, figsize=(8,8), sharex=True)
ax1.imshow(time_temp_steel_df.T, aspect='auto', origin='lower', cmap='jet', vmin=20, vmax=800, extent=[0,3600,0,280])
ax2.imshow(time_temp_copper_df.T, aspect='auto', origin='lower', cmap='jet', vmin=20, vmax=800, extent=[0,3600,0,280])
ax3.imshow(time_temp_concrete_df.T, aspect='auto',origin='lower', cmap='jet', vmin=20, vmax=800, extent=[0,3600,0,280])
ax1.set_ylabel("Z / m")
ax1.set_title("Steel")
ax2.set_title("Copper")
ax3.set_title("Concrete")

ax2.set_ylabel("Z / mm")
ax3.set_ylabel("Z / mm")
ax3.set_xlabel("Time / s")
fig.subplots_adjust(right=0.81)
cbar_ax = fig.add_axes([0.85, 0.11, 0.03, 0.77])
fig.colorbar(heatmap, cax=cbar_ax, label="Temperature / $^\circ C$")
plt.savefig('figs/beam_temp_dev.svg')
plt.close()
Step 3#
Evaluate the surface temperature of the solid obstructions via BNDF with quantity WALL TEMPERATURE. View the results in SMOKEVIEW at different timesteps.
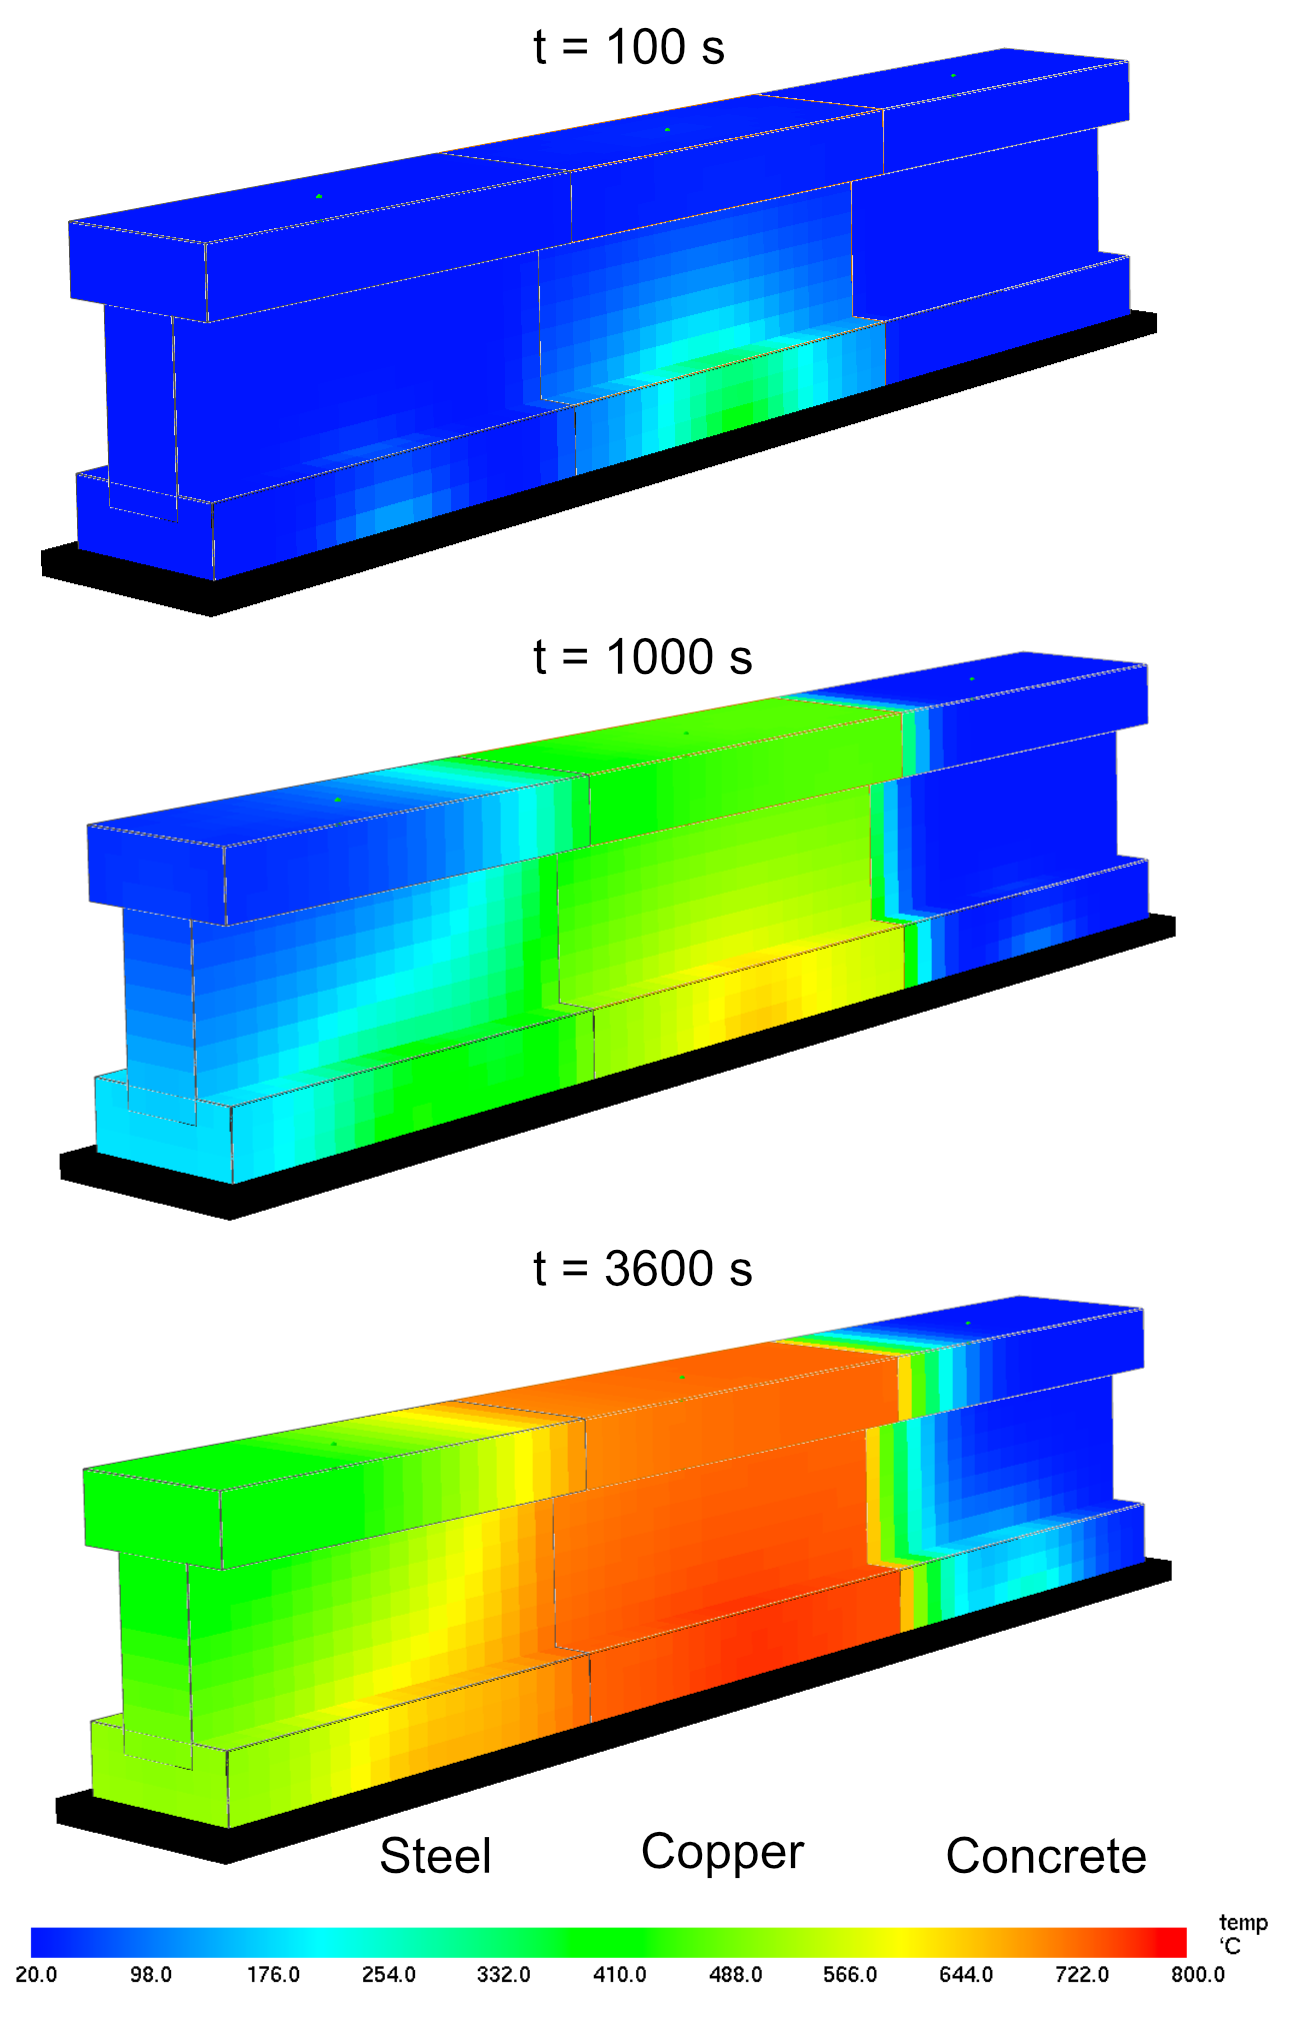
Fig. 6.44 BNDF of WALL TEMPERATURE for different MATL at timesteps t = 100, 1000, 3600 s for different materials (MATL) steel, copper, concrete#
Step 4#
This task provides the same setup as in the previous tasks except that the heat source does not act as a constant surface temperature on the components but as a VENT with a predefined HRR. Replace the heat sources in the given FDS file with following lines:
&REAC FUEL               = 'METHANOL'
      FYI                = 'Methanol C_1 H_4 O_1'
      CO_YIELD           = 0.001
      SOOT_YIELD         = 0.001 /

&SURF ID='FIRE', COLOR='RED', HRRPUA=100./
&VENT XB = -0.6,0.6, -0.1,0.1, 0.0,0.0, SURF_ID='FIRE' /
Modify the FDS file in a way that the radiative as well as the convective heat transfer are considered. If two-way coupling with the gas phase is desired, then you have to set HT3D=.TRUE on the SURF line associated with the OBST faces.
Evaluate the temperature within the solid obstructions at timesteps t = 100 s, 1000 s, 3600s by adding SLCF in the XZ and YZ and the BDF of WALL TEMPERATURE as well as the RADIATIVE HEAT FLUX, CONVECTIVE HEAT FLUX and NET HEAT FLUX. To increase the speed of the computation use multiple meshes (MPI). Due to the relatively long runtimes of the simulation, you can download the precomputed result datasets here: ht3d_gasphase_example.zip. Explain how the different distribution of heat flux is related to the respective material properties.
data_root = root + 'data/heat_transfer/ht3d_gas/rundir'
sim = fdsreader.Simulation(data_root)
slice_axial = sim.slices[0]

def get_full_slice_at_timestep(slcf, time):
    time_index = slice_steel.get_nearest_timestep(time)
    slcf_list = []
    time_index = slcf.get_nearest_timestep(time)
    for i in range(0,3):
        subslice = slcf[i].data[time_index]
        slcf_list.append(subslice.T)
    return np.concatenate(slcf_list, axis=1)

vmin = 20
vmax = 200

fig, (ax1, ax2, ax3) = plt.subplots(3,1, figsize=(10,10), sharex=True)
slcf = get_full_slice_at_timestep(slice_axial, 100)
heatmap = ax1.imshow(slcf, origin='lower', cmap='jet',vmin=vmin, vmax=vmax)
slcf = get_full_slice_at_timestep(slice_axial, 1000)
ax2.imshow(slcf, origin='lower', cmap='jet',vmin=vmin, vmax=vmax)
slcf = get_full_slice_at_timestep(slice_axial, 36000)
ax3.imshow(slcf, origin='lower', cmap='jet',vmin=vmin, vmax=vmax)
ax1.set_title("T = 100 s")
ax2.set_title("T = 1000 s")
ax3.set_title("T = 3600 s")
ax1.set_ylabel("$n_{cells}~Z$")
ax2.set_ylabel("$n_{cells}~Z$")
ax3.set_ylabel("$n_{cells}~Z$")
ax3.set_xlabel("$n_{cells}~X$")
ax1.text(10, 20, "Steel", ha='center', color='white')
ax1.text(30, 20, "Copper", ha='center', color='white')
ax1.text(50, 20, "Concrete", ha='center', color='white')
ax2.text(10, 20, "Steel", ha='center', color='white')
ax2.text(30, 20, "Copper", ha='center', color='white')
ax2.text(50, 20, "Concrete", ha='center', color='white')
ax3.text(10, 20, "Steel", ha='center', color='white')
ax3.text(30, 20, "Copper", ha='center', color='white')
ax3.text(50, 20, "Concrete", ha='center', color='white')
fig.subplots_adjust(right=0.81)
cbar_ax = fig.add_axes([0.76, 0.13, 0.02, 0.75])
fig.colorbar(heatmap, cax=cbar_ax, label="Temperature / $^\circ C$")
plt.savefig('figs/beam_temperatures_axial_gas.svg', bbox_inches='tight')
plt.close()

Fig. 6.45 SLCF of TEMPERATURE at Y = 0 at timestep t = 3600 s for different materials (MATL) steel, copper, concrete (solid phase + gas phase)#
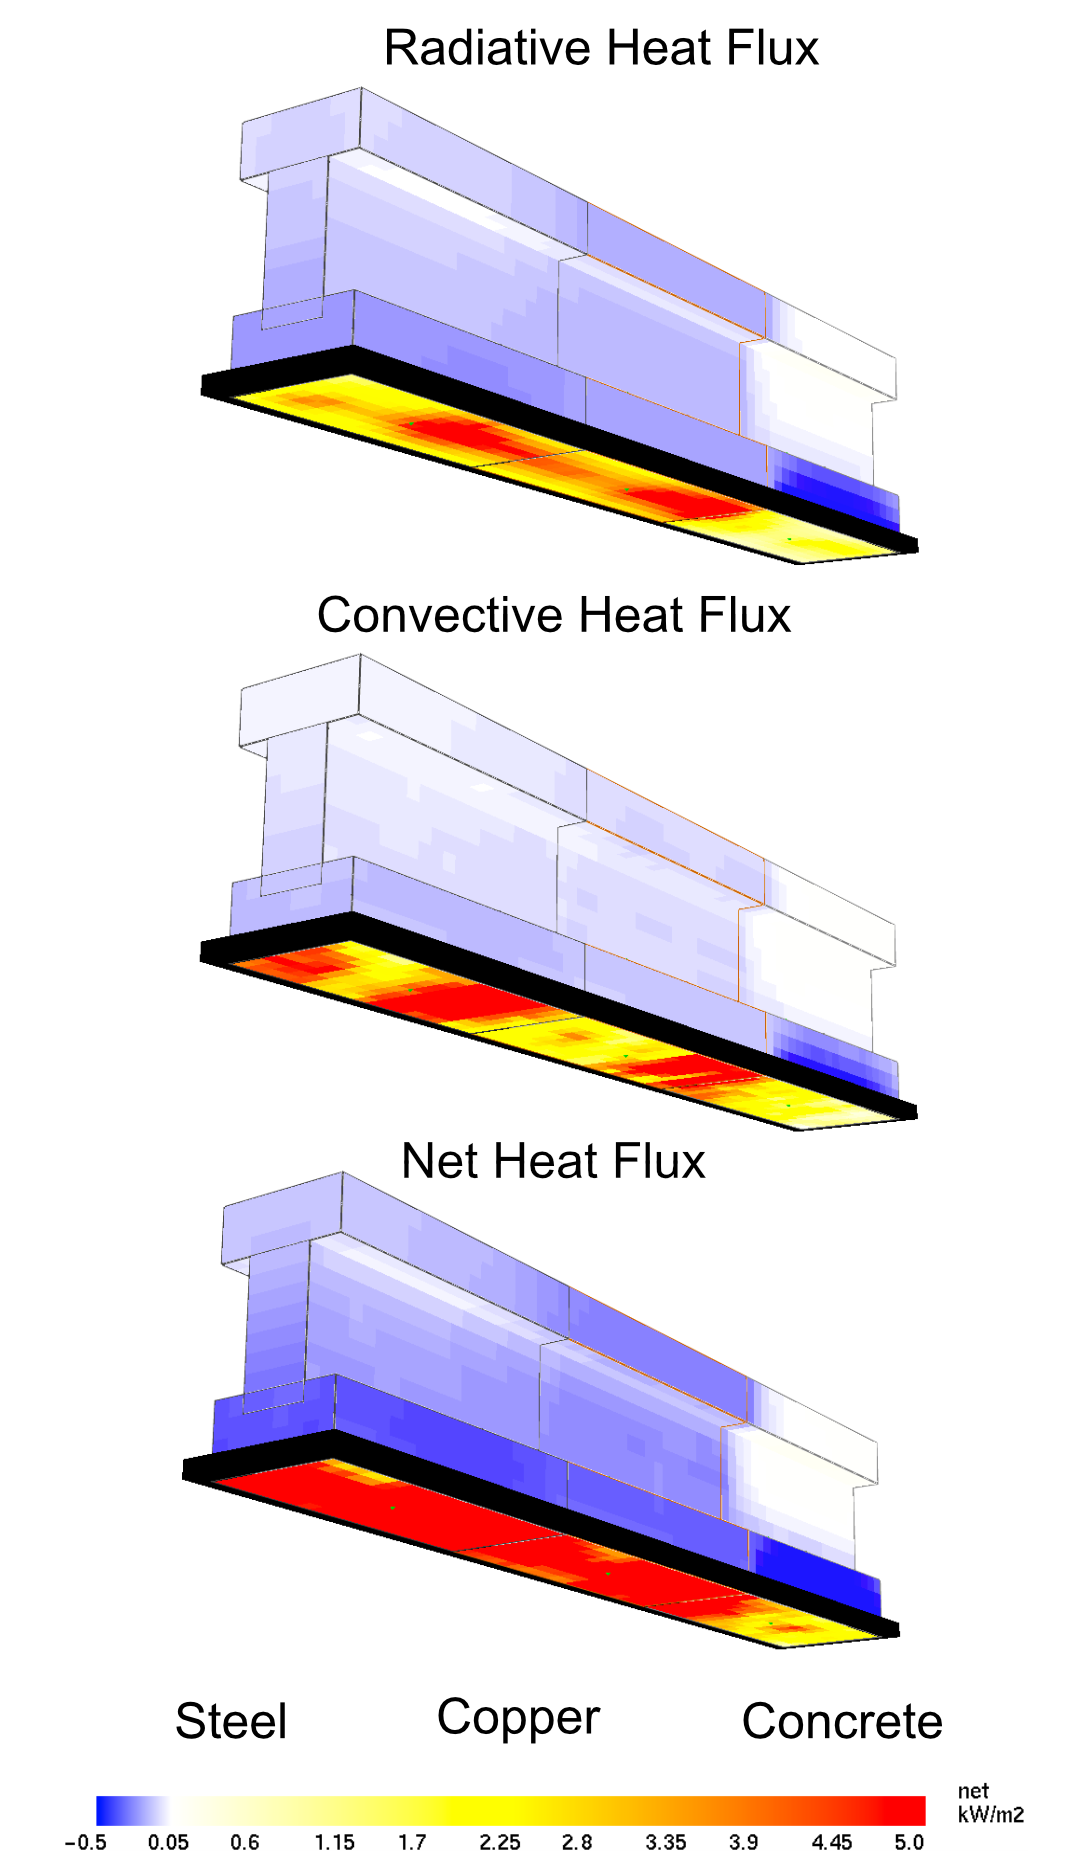
Fig. 6.46 BNDF of RADIATIVE HEAT FLUX, CONVECTIVE HEAT FLUX, NET HEAT FLUX at t = 3600 s for different materials (MATL) steel, copper, concrete#