import matplotlib
import matplotlib.pyplot as plt
import numpy as np
import pandas as pd

from IPython.display import display
from PIL import Image

import os
# check for set environment variable JB_NOSHOW
show = True
if 'JB_NOSHOW' in os.environ:
    show = False
Basic Example, Data Analysis II#
Setup Description#
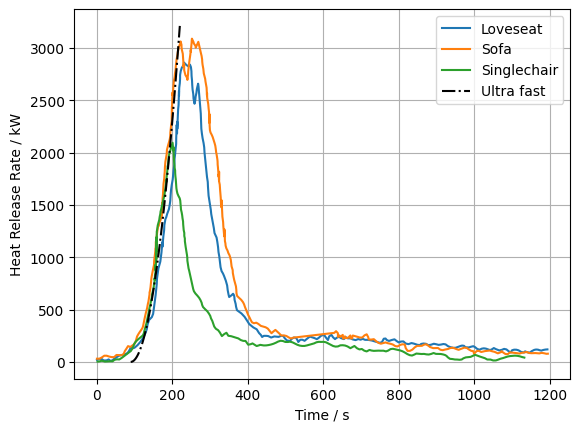
The goal here is to plot Figure 1.13, which shows the heat release rates (HRR) of different pieces of furniture, as documented by Babrauskas and Lawson. We aim to fit the ‘t-squared’ design fire with a fire-growth coefficient of 0.19 kW/s² and a virtual ignition time of 90 seconds to the experimental data.
We will follow these steps:
Download the CSV files: The values to be plotted have been extracted from figure 16 in the article using WebPlotDigitizer and can be downloaded as text files for:
Read the files.
Define a function for the design fire.
Use the function to describe the design fire HRR.
Plot the HRR curves.
Following the previous example, we will use the Python libraries os, pandas, numpy and matplotlib.
# Import libraries
import matplotlib.pyplot as plt
import pandas as pd
import numpy as np
import os
#Function for growth of fire from section 1.2 Fire Safety Engineering, Fire Scenario:
def alpha_t_squared(time, alpha):

    #HRR = α×time^2
    HRR = alpha * np.square(time)

    return HRR
#Describe the Design fire HRR:
time_series = np.linspace(0,130)#creating time series
alpha=0.19  # ultra fast
HRR = alpha_t_squared(time_series, alpha)
# Check files with experiment data.
folder_path=os.path.join("data", "Furniture_calorimetry")
files = os.listdir(folder_path)
print(files)
['Fig16_LoveSeat.txt', 'Fig16_Sofa.txt', 'Fig16_SingleChair.txt']
# Read the data from the experiments.
for file in files:
    # Filter out specific type of files.
    if file.endswith('.txt'):
        # Create data series label.
        label = os.path.splitext(file )[0].split('_')[-1]  # Extract label from filename

        # Read file.
        file_path = os.path.join(folder_path,file)
        furniture_df = pd.read_csv(file_path, header=0)

        if "Chair" in file:
            # Shift data series such that the increasing slopes align.
            time_shift = 60
        else:
            time_shift = 0

        # Plot data series.
        plt.plot(furniture_df['Time'] - time_shift,
                 furniture_df['HRR'],
                 label=label.capitalize())

# Plot alpha_t_squared function results.
virtual_ignition_time = 90
plt.plot(time_series + virtual_ignition_time,
         HRR,
         color='k', linestyle='-.',
         label="Ultra fast")


# Plot meta data.
plt.xlabel("Time / s")
plt.ylabel("Heat Release Rate / kW")
plt.legend()
plt.grid()

# Show plot.
plt.show()


